Clustering by fast search-and-find of density peaks
Cluster analysis is aimed at classifying
elements into categories on the basis of their similarity. Its applications
range from astronomy, to bioinformatics, to bibliometrics, and pattern recognition.
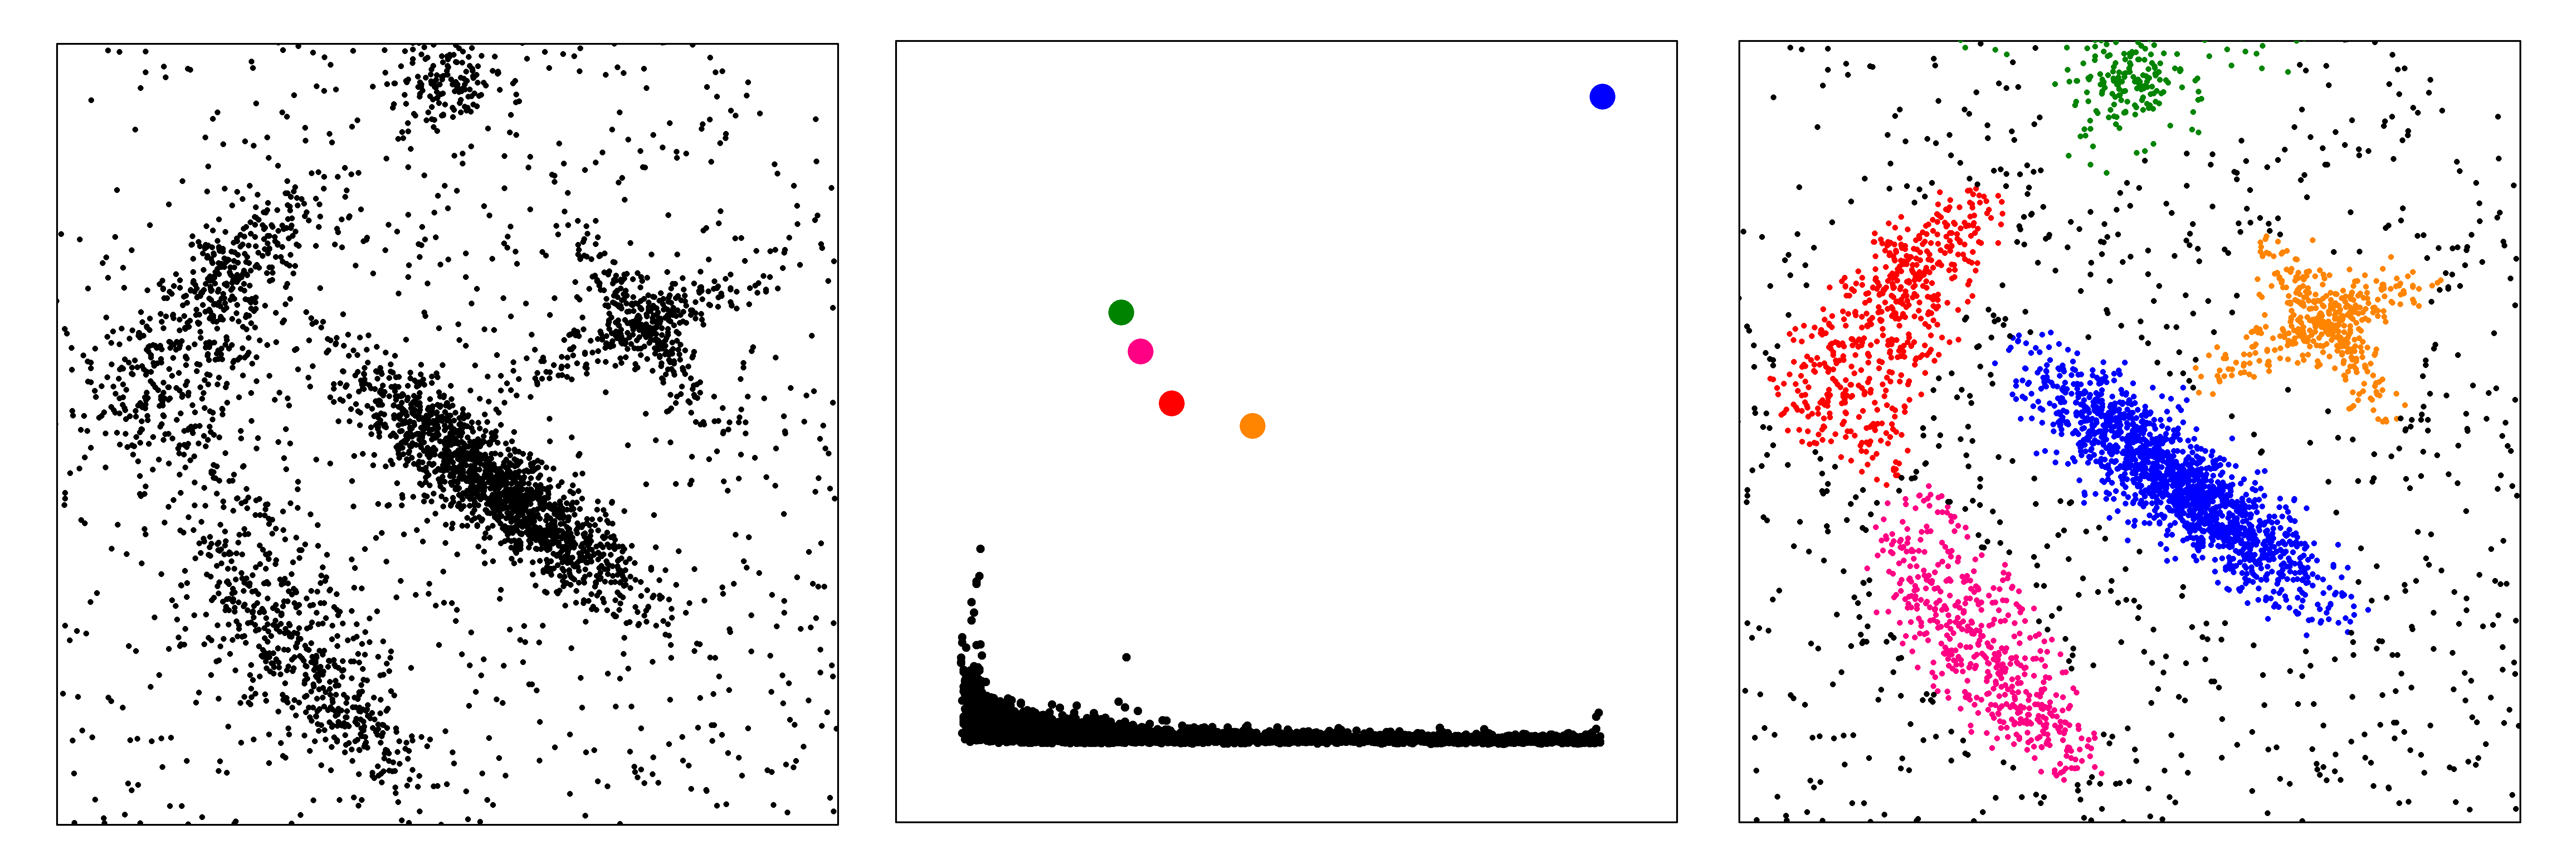
We introduced an approach based on the idea that cluster centers are characterized
by a higher density than their neighbors, and by a relatively large distance from
points with higher densities. This information is summarized in the so called
decision graph in which for each data point the density is plotted as a function of the minimum distance from a data point with higher density. A simple analysis of this graph
allows finding directly and intuitively the number of clusters, outliers are automatically spotted and excluded
from the analysis, and clusters are recognized regardless of their shape and of
the dimensionality of the space in which they are embedded.
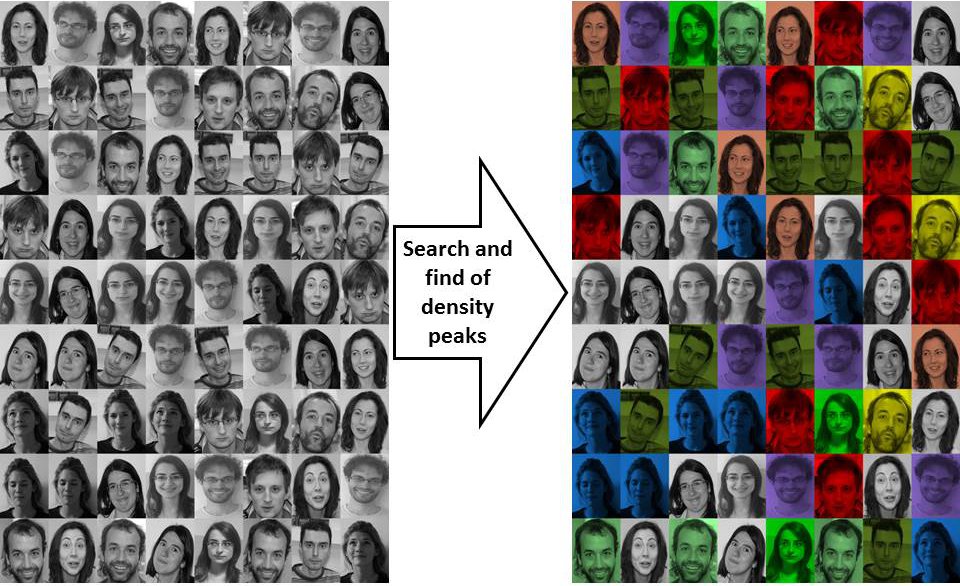
When applied with a proper distance function the method is quite robust to assign
a set of faces to the correspondent individuals with a success that is greater
than other state of the art methods.
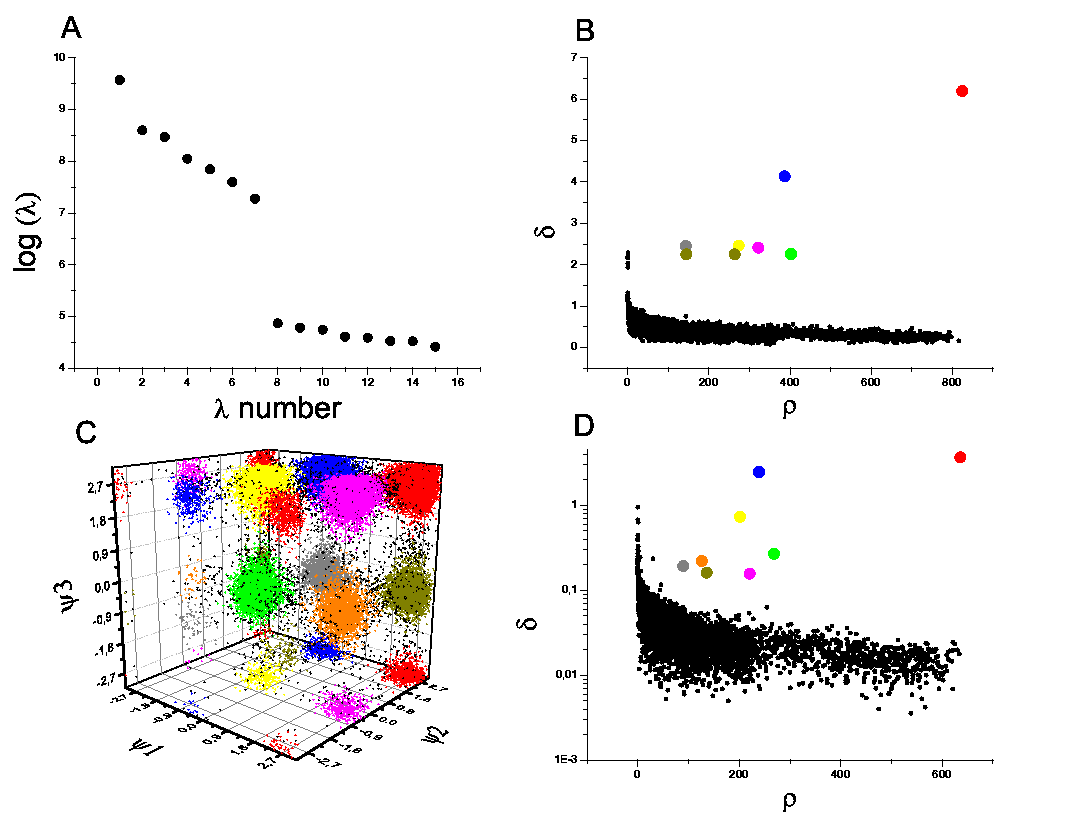
Moreover, when applied to Molecular Dynamics trajectories, the results are coherent
with a much more complex kinetic model, even when employing different
similarity measures like RMSD or Dihedral distance.
A Matlab script with an example input file can be obtained by following this
Matlab code
.
The data used for Figure 2 can be downloaded here:
data for figure 2
The matrix with the distances between the 400 images in the Olivetti dataset used in the article can be downloaded at:
Distance matrix Olivetti dataset
The datasets investigated in Fig. 3 can be downloaded at Artificial datasets
The trajectory of 3Alanine used to perform the analysis in Fig S10 can be downloaded at Ala3 trajectory
Bibliography
Clustering by fast search and find of density peaks
SCIENCE, 1492, vol 322 (2014)