Nematic elastomers: Results |
Typical experimental measurements are made by stretching clamped thin sheets. The presence of the clamps induces nonuniform stretches in the sample, but the effects of spatial stress inhomogeneity have been up to now neglected. Analogously, the observation of microstructure formation only in some parts of the sample (Zubarev et al., 1999) is not explained by an analysis restricted to macroscopically homogeneous strains.
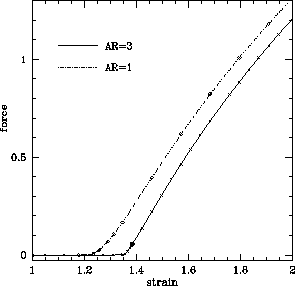 Trasmitted force versus displacement
The fingerprint of the liquid-like response at small stretches is a
the flat force-displacement curve. The computed plots
illustrate the presence of a sharp transition from the soft response
at small stretches to a rubber-like response at larger stretches for
two different values of the aspect ratio. The
critical strain is significantly reduced with respect to the value in
the macroscopically affine approximation which is typically used to
interpret experimental results, expecially at the smaller
aspect ratio.
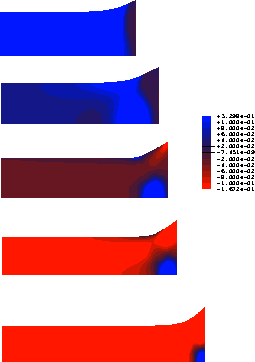 Microstructure Index
The microstructure index distringuishes the regions where
microstructure is formed (blue) from the ones where it is not
(red). At small stretches the entire sample is in the liquid region,
at higher stretches, only
an island containing microstructure (in the smectic
phase, see below) survives, and it is confined
around the central part of the clamps.
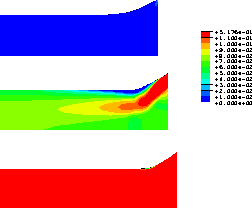 von Mises stress
The von Mises stress vanishes at small stretches, and
is nonzero all across the sample at large stretches. At intermediate
stretches, the stress transmission path corresponds to an X with
kinked legs. The presence of the kink is related to the transmission
of tensile stresses in the smectic island (compare previous
Figure).
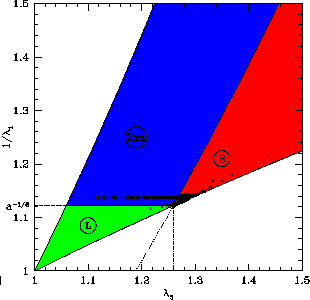 Phase distribution
The distribution of the macroscopic gradients in the phase diagram
shows the presence of many points well inside the smectic phase.
All points in the smectic phase are almost exactly on a line of
constant smallest principal strain, due to the fact that the energy in phase
Sm is a convex function of the smallest principal strain alone.
This plot corresponds to the intermediate stretch of the previous
figures, s=1.38.
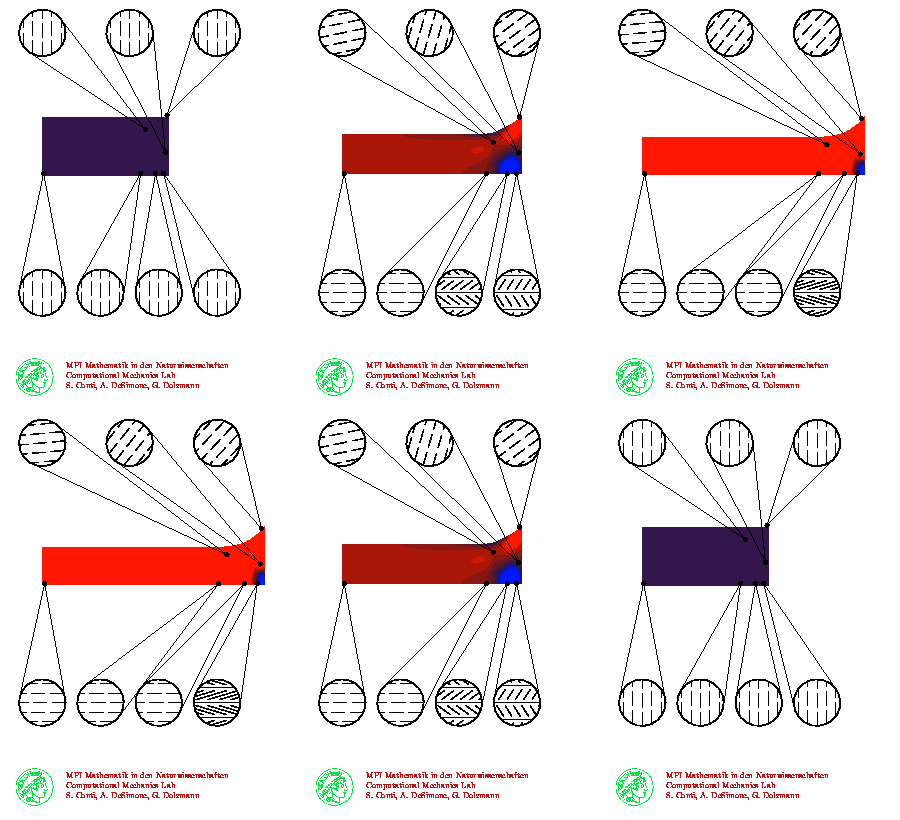 Reconstruction of microstructure
The colors represent the microstructure index; the circles represent
the blow-up of a possible reconstruction of the local microstructure.
Forward: Nematic Elastomers